
You want to know how good a playmaker a certain player is? Show how many assists he provided. Want to belittle a certain midfielder's contribution in a season or a match? Show how few assists he provided. Congratulations, now you've won the playmaking argument. Or is it that way?
Sure, assists provide somewhat of an over-generalised overview of how much direct contribution players do in terms of playmaking. Any great playmaker in the 21st century that comes to your mind must have aced that metric. Here are some examples:
- Lionel Messi: 357 club career assists.
- Kevin De Bruyne: 259 club career assists.
- Xavi Hernández: 216 club career assists.
- Frank Lampard: 171 club career assists.
- Toni Kroos: 166 club career assists.
But let's take a look for example at the UEFA Champions League. Can you guess the top assists provider of all time? Spoiler alert: it's not one of the players mentioned above.
It's Cristiano Ronaldo, with 42 assists. But wait, this shouldn't be a big surprise. Cristiano has played the most matches in the competition and he's one of the greatest players of all time. So let's switch to the EPL to get a better grasp on what I'm trying to show here.
Who provided the most assists in the EPL last season? Mohamed Salah? Martin Ødegaard? EPL & Ballon d'Or winner Rodri? The answer is fourth-placed Aston Villa's striker… Ollie Watkins, with a whopping 13 assists.
Clearly this could be a glitch in the matrix. But if you ask the good question, was Watkins really the best playmaker in the EPL last season? Or are we looking at this the wrong way?
What's Wrong With Assists?
If you are a data analyst worth your salt, you know that looking at one metric alone and coming up with conclusions without context is insane. However, assists is the oldest playmaking metric, and it happens to be everywhere, which leads to people overusing it. But that's not the only reason why (from an analyst perspective) it sucks.
1. All assists are created equal
Do you remember the best assist in history? If not, refresh your memory with the infamous Busquets assist to Messi vs Real Madrid in the semi-final of the 2010–2011 UCL.
Now watch Marcelo's assist to Cristiano Ronaldo vs Bayern Munich in the round of 16 of the 2016–2017 UCL.
You can clearly see that both of these assists are not equal. In fact, one of them can't even be called an assist. However, whoever gets the last touch before the final shot is awarded with one assist!
2. Only the touch before last matters
Look at the following clip and imagine you are Messi. You carry the ball from your own half up until the opponent's box and provide a very tricky pass that puts Alba one-on-one with the keeper, only for Alba to pass it across to Neymar who scores. Not a bad decision from Alba, but it gives him the assist and gives Messi nothing.
3. You are relying on other players
No matter how good your pass is, no matter how many players you dribbled past to provide a very beautiful, very efficient assist to another player, it all hangs on that player's ability to put the ball in the back of the net. If they miss, then you created absolutely nothing! Like in this example with Neymar and Mbappé.
Now that we know why Assists is a bad metric to judge playmakers by, how can we judge a playmaker then? The answer is: don't use just one metric. But since we started with assists, let's build upon it by identifying new metrics that solve our problems one by one.
Expected Assists (xA)
Expected Assists (xA) measures the probability that a pass will be an assist. The model is based on the finishing location of the pass, the type of pass, and a variety of other factors. This model is not reliant on whether a shot was taken from this pass, so it credits all passes, regardless of whether they result in a shot.
Similar to Expected Goals (xG), this model tries to take into account what could have been. So now you are not relying on others' abilities to finish or even shoot. You are relying on the pass ending at a location of high goal-scoring possibility. So if you make a pass to a player who receives it (touches it) at a location and condition that, if he shoots from that spot, he has a 0.3 (30%) chance of scoring, a 0.3 will be added to your xA total regardless of that player's action.
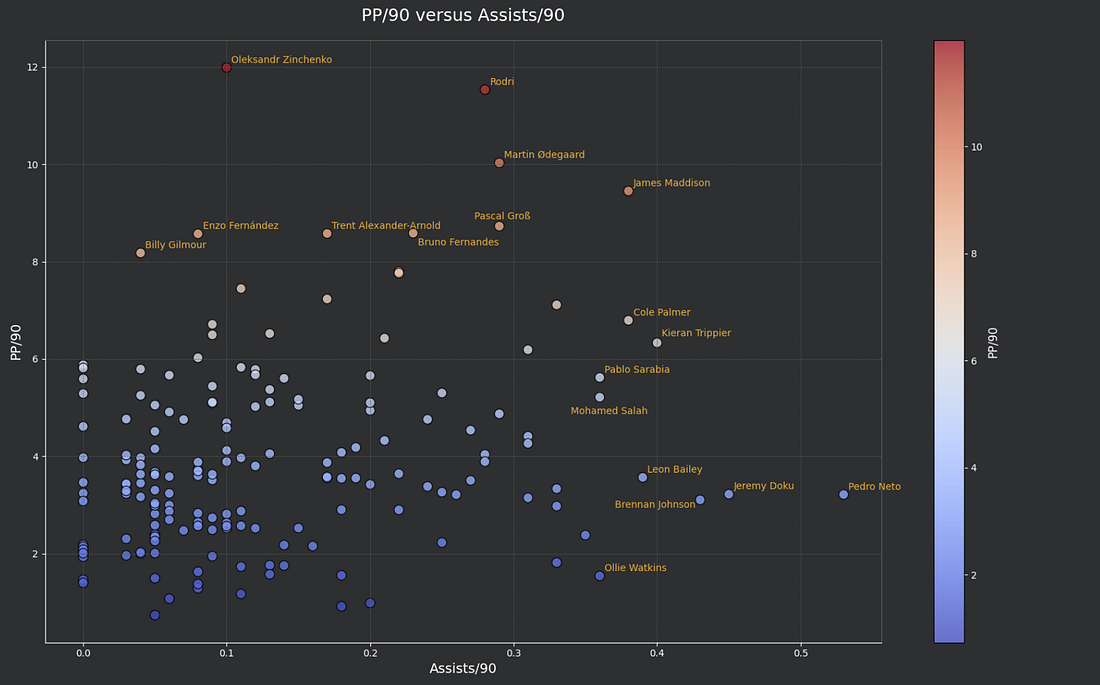
Recall our 2023–2024 EPL assists stats from earlier? Let's plot a graph for the assists per 90 minutes.
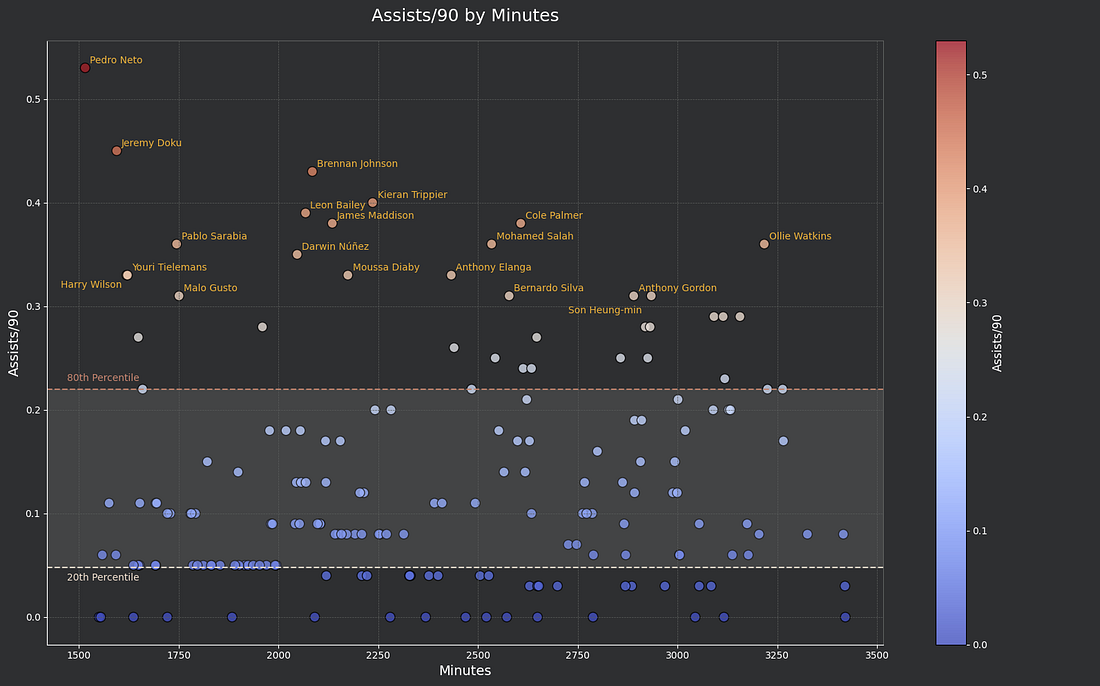
You can see that players like Pedro Neto and Jeremy Doku have had the most assists per 90, while Ollie Watkins is still having a decent share but not the best despite being the top assister that season.
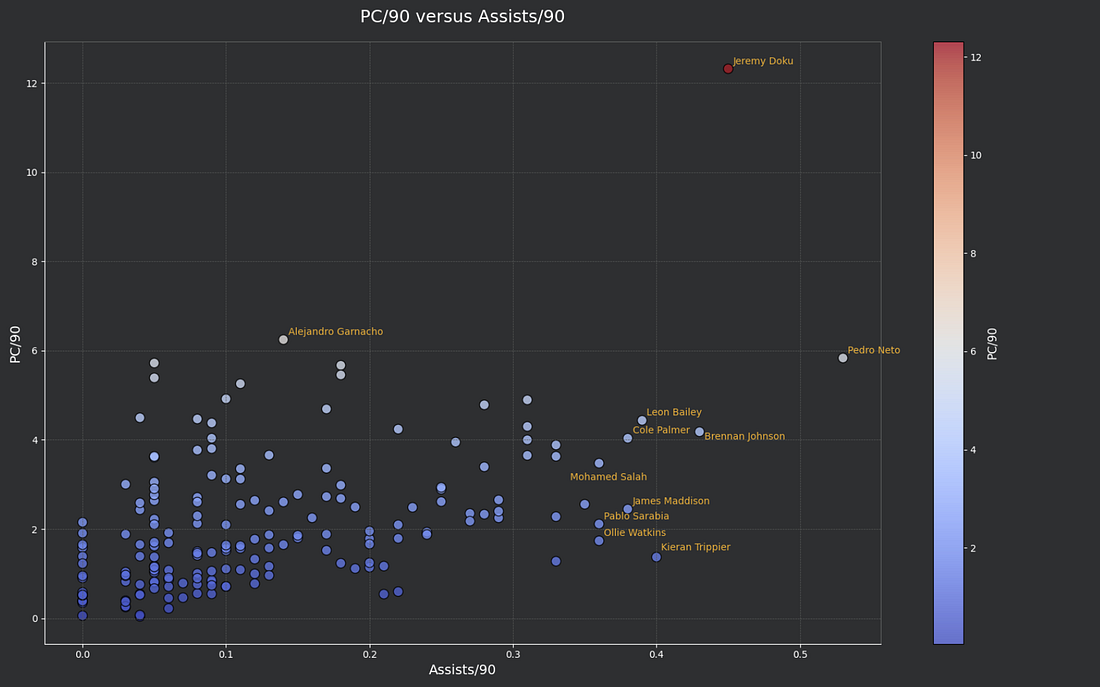
Now let's look at the expected assists per 90 minutes for the same season.
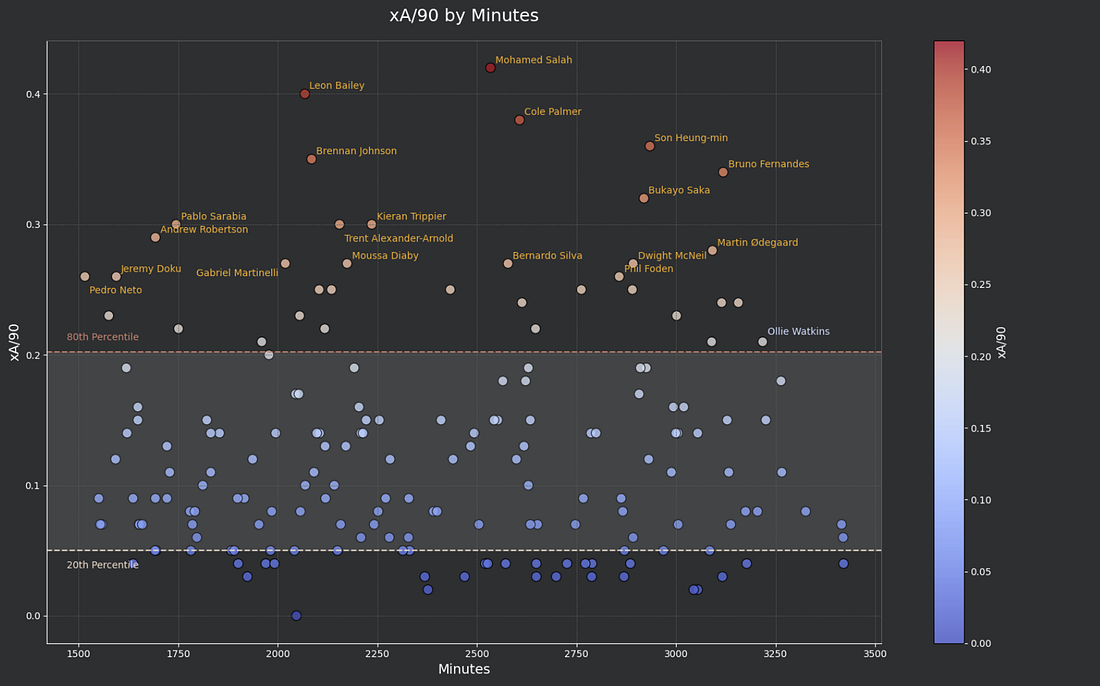
Will you look at that. Players like Mohamed Salah, Leon Bailey, and Cole Palmer are now more recognised for their playmaking efforts, while players like Jeremy Doku and Pedro Neto are having less xA/90, showcasing that they got more lucky: that their passes were converted to goals more than others. And look where Ollie Watkins is.
Now let's plot the xA/90 versus the Assists/90 for each player for the same season.
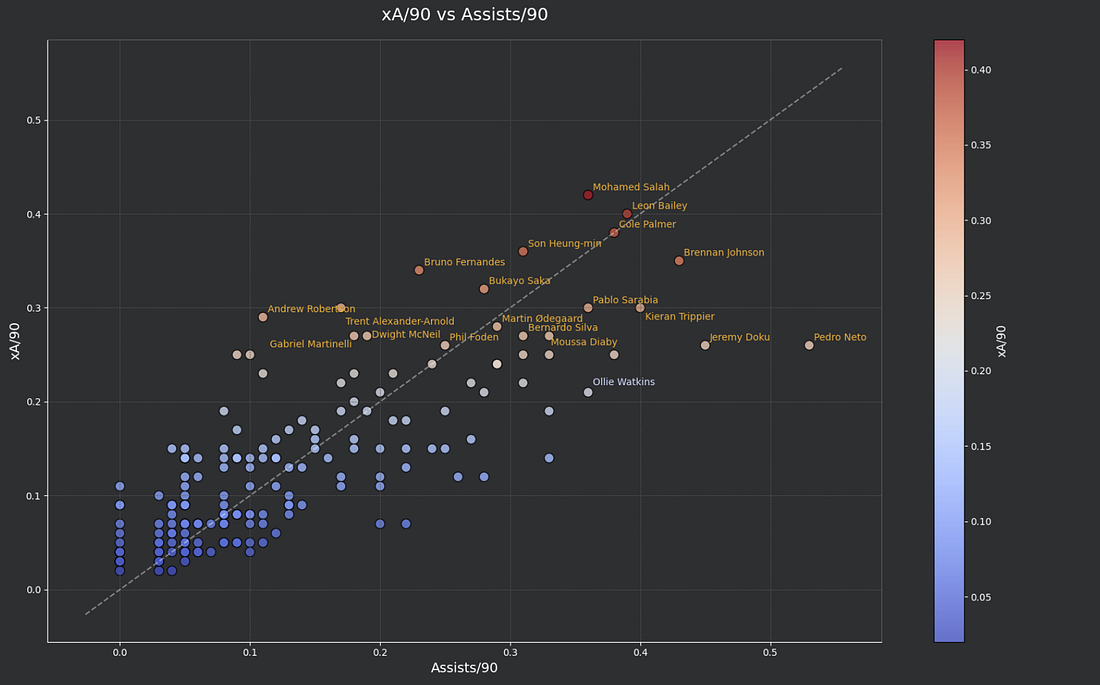
According to the xA metric, players above the dashed line should have had more of their passes converted to assists, while players below the line should have had fewer of their passes converted to assists.
Okay, so xA is awesome, we should use it and call it a day, right? Not quite. While xA solves most of the assists problem and gives credit to potential dangerous passes, alone, it's not complete:
- It still relies totally on the end location of the pass. While that is important, it still gives Alba more credit than Messi in the video we mentioned earlier, since Neymar's position to score is highly more likely than Alba's.
- All passes are still equal. Yes, more credit is given to passes that don't end up as a goal or even a shot, but all passes are still considered equal as long as they land at the same spot under the same conditions, no matter if it's a long pass, a curved pass, or a short pass setting up a tap-in.
- It only cares about passes. Recall Neymar's failed assist to Mbappé. As awesome as that back-heel pass is, xA neglects all the effort Neymar did dribbling through the enemy team and only gives credit to that pass at the end.
Progressive Stats
Let's take it a step further and discuss a couple of what are called Progressive metrics.
Progressive Passes are defined by Opta as completed passes that move the ball towards the opponent's goal line at least 10 yards from its furthest point in the last six passes, or any completed pass into the penalty area. Excludes passes from the defending 40% of the pitch.
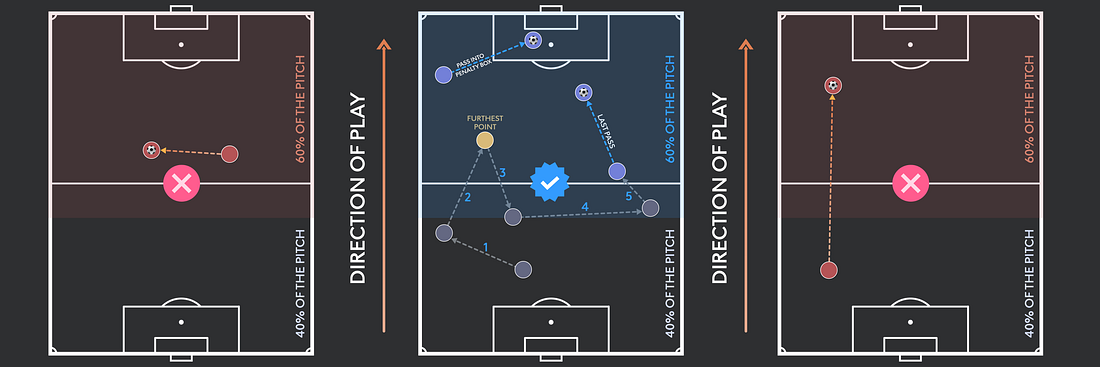
As shown in the picture above, these are the conditions for a pass to be considered a Progressive Pass:
- The pass must be from the 60% of the pitch closer to the opponent's goal, which excludes the picture on the right.
- The pass must move the ball forward toward the opponent's goal line at least 10 yards further than the furthest pass of the last 6 passes, which excludes the picture on the left.
- You can neglect the above conditions if the pass is from outside the penalty box and goes into the penalty box.
If you tick these conditions, one Progressive Pass is added to your passing stats.
This stat helps to recognise passes that move the ball closer to the goal line, even if it doesn't result in a dangerous position, a shot, or a goal. This is the beginning of a series of metrics that give credit to players who participate in the build-up phase but don't necessarily create chances directly from their passes.
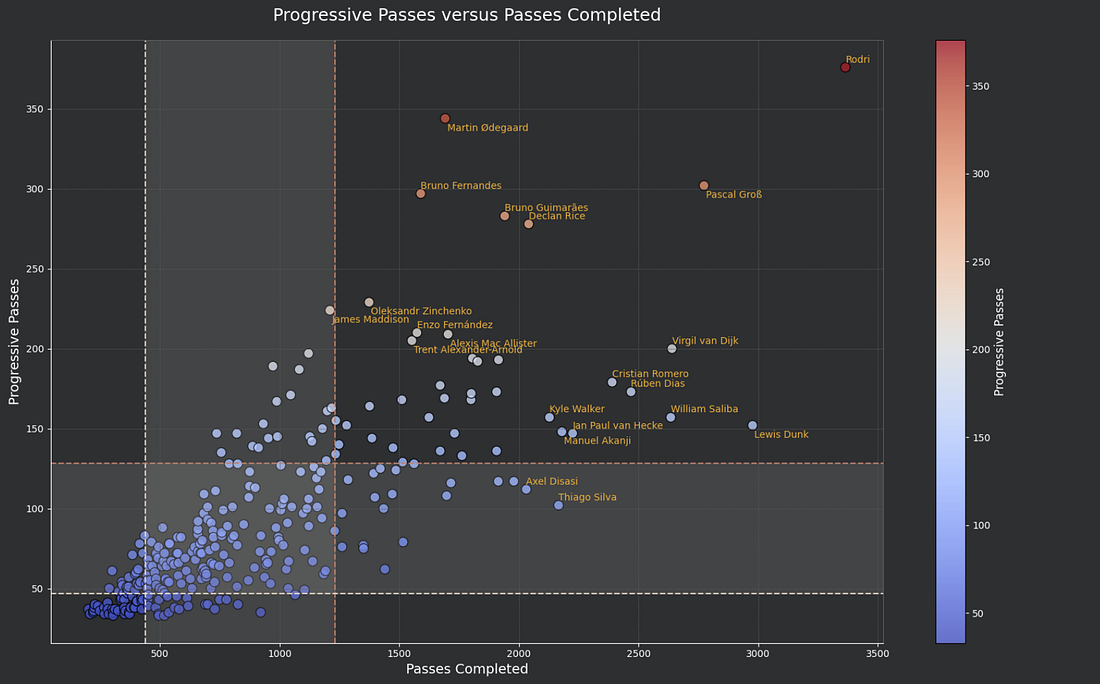
As shown above for EPL 2023–24, players like Zinchenko, Rodri, and Ødegaard have an impact on progressing the ball forwards while not having as many assists in contrast to players like Pedro Neto and Jeremy Doku.
You also have to take into account the number of passes completed for each player, as some players are given more chances to pass the ball than others, thus stacking up in stats. Here are the stats for Progressive Passes vs Passes Completed for EPL 2023–24:
Progressive Carries are defined by Opta as carries that move the ball towards the opponent's goal line at least 10 yards from its furthest point in the last six passes, or any carry into the penalty area. Excludes carries which end in the defending 50% of the pitch.
Similar to Progressive Passes, this metric rewards players who help their team advance forward using ball carries or dribbling.
And here, ladies and gentlemen, we get to our first Outlier: Jeremy Doku, who didn't appear to help progress the ball through passing a lot, is actually in a league of his own when it comes to progressing the ball through carrying and/or dribbling. Imagine if we didn't resort to such a metric to judge a player's playmaking ability!
Now we can plot Progressive Passes against Progressive Carries for EPL 2023–24 to see which players excel in one or the other, or both.
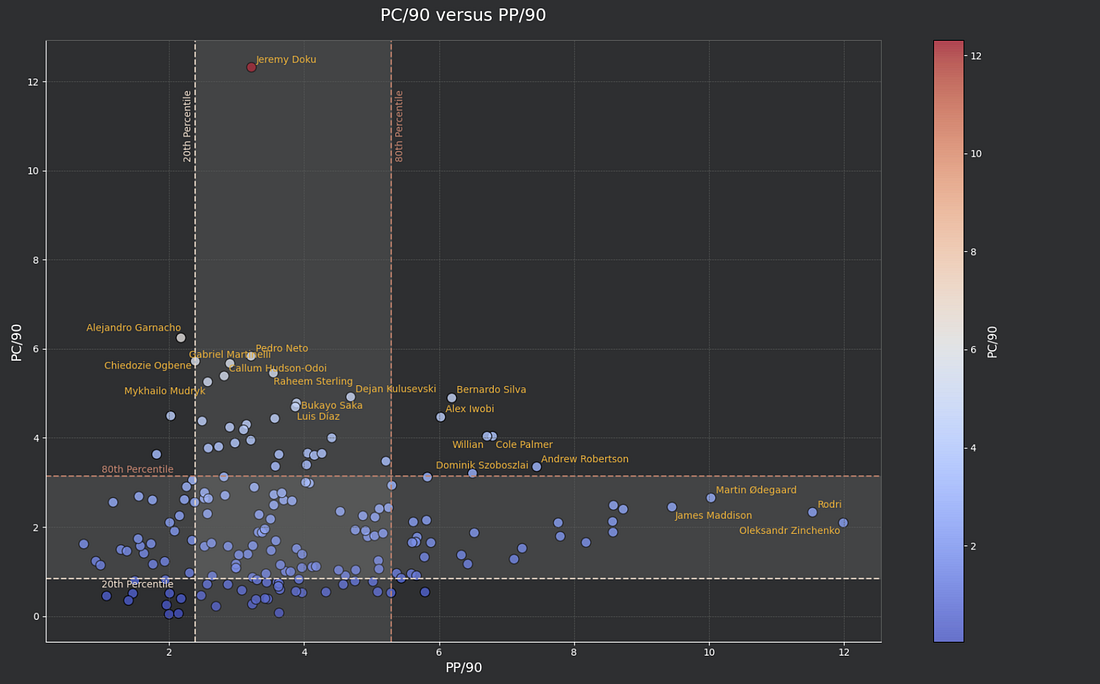
The vertical y-axis plots the data for Progressive Carries, while the horizontal x-axis plots the data for Progressive Passes. The shaded part is where 20–80% of the players lie, so people on the top right of the shaded area like Bernardo Silva and Alex Iwobi are ranking high in both progressive metrics.
Other Build-Up Metrics
Now let's get back to our xG model and discover what else we can fetch from it.
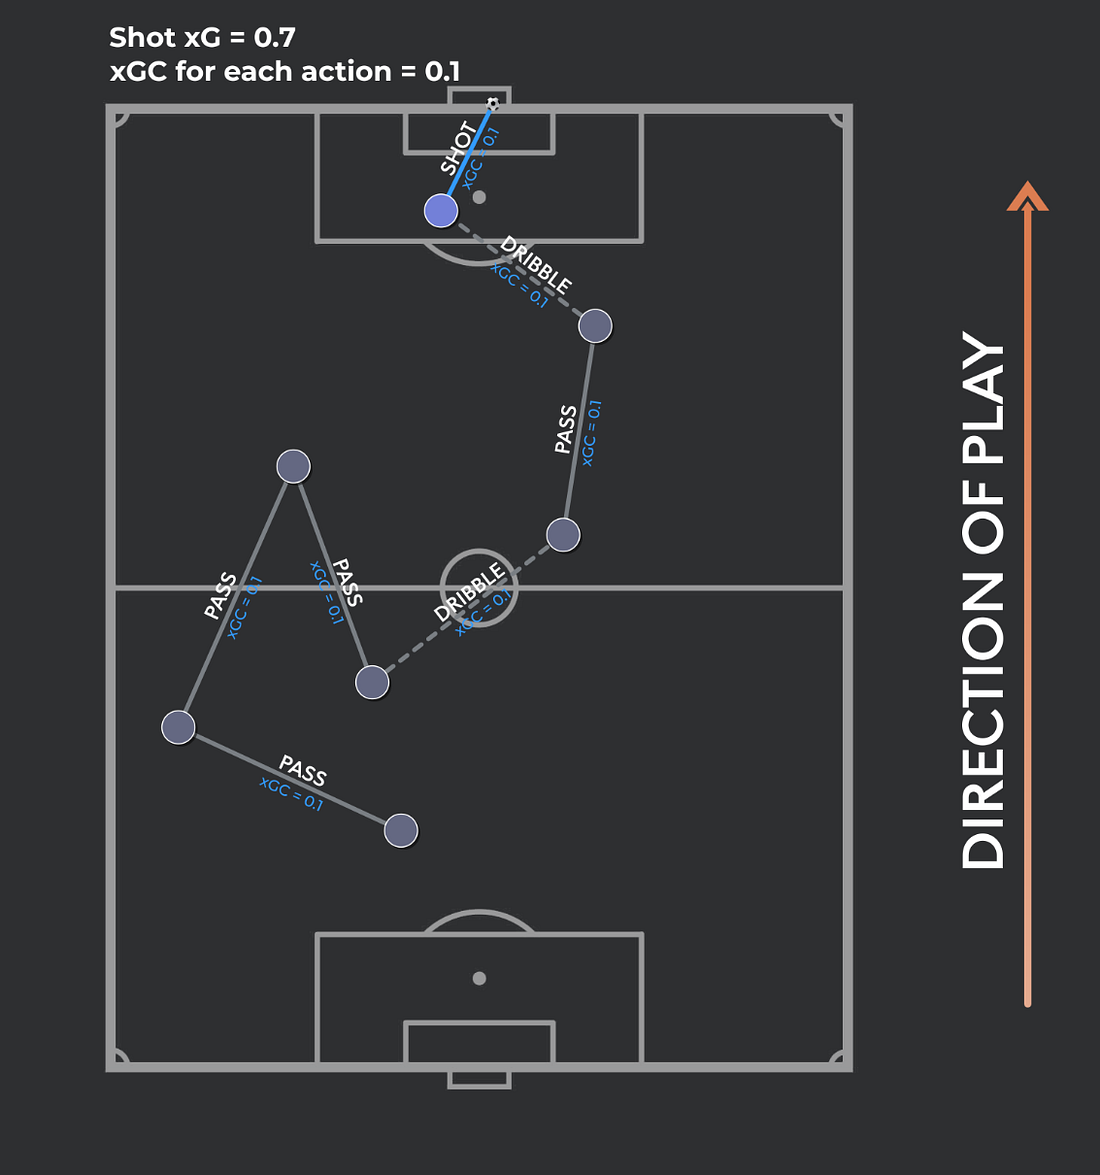
xGChain (xGC) values the attacking contributions of players involved earlier in a build-up that ends with a shot. It helps us reward the actions that took place before the assist and subsequent goal.
Some models calculate xGC by dividing the xG of the shot by the number of actions involved in the build-up. Each action gets equal credit no matter how involved they were. For example: a shot worth 0.7 xG divided among 7 actions in the build-up = 0.7/7 = 0.1 xGC for each action. (Note that the shot is also included in the xGC as it's counted as one of the actions.)
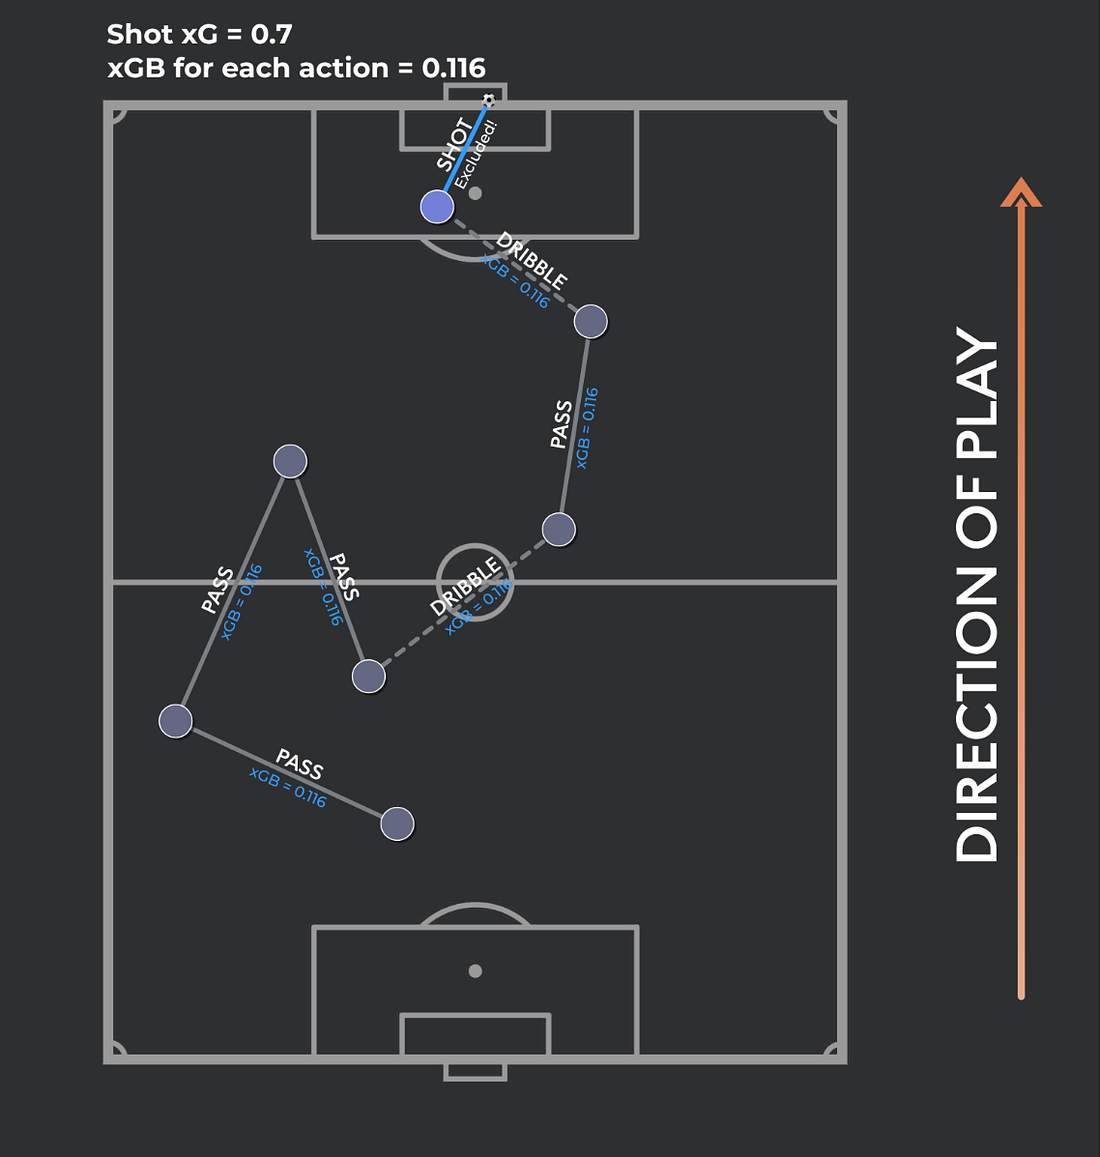
xGBuild (xGB) is similar to xGC with one exception: it doesn't count the shot as part of the sequence that led up to it. So following the last example, that same shot worth 0.7 xG will now be divided among 6 actions instead of 7 = 0.7/6 = 0.116 xGB for each action.
Progressive vs xGC & xGB
Let's pause a bit here and discuss what xGC and xGB can provide differently from progressive metrics.
Progressive metrics credit players who do more than just participate in the build-up phase of a shot or a goal. They more likely reward players who have a positive contribution, i.e. move the ball forward closer to the goal line. However, progressive stats also see all contributions the same, as long as they pass the necessary conditions. If you are a player and you dribbled through the whole pitch and passed the ball to your teammate, congratulations, you just only gained one more progressive stat!
xGC and xGB assess the situation differently. Based upon the xG model, they have an advantage of differentiating between a good chance (high xG) and a normal one (low xG), and not giving the same score to everything. They include passes, carries, and dribbles all in their model, making them more versatile. They also allow you to credit players that contribute to chances from the back line, players who are normally not that much included in any playmaking discussion despite the rise of good-on-the-ball defenders. That said, since they are both derived from the xG model, they only care about chances that end with a shot, neglecting other efforts that might have had a higher impact. Also, the "fair" distribution of xGC and xGB among all players participating in the build-up phase is not actually fair, as not all players equally contribute to the offence.
In addition, the players who will stand out in xGC & xGB are usually going to be strikers, or those assisting them, since they're more likely to be involved in moves that lead to shots, after all. But it still gives you a slightly more holistic view of attacking contribution than arbitrarily cutting off at shots and assists.
xGAdded, xT, and VAEP
One last step in these possession-based stats: we can take a brief look at some more advanced metrics.
xGAdded is a metric that measures the value of passes. Basically it assigns a "danger" value to the start and end location of a pass. The difference between both values is the xG added by the player making the pass.
Expected Threat (xT) assigns a value to every position on the pitch. Each state has a probability of a goal being scored from that position. The difference in threat between moving the ball from State A to State B is the value that's assigned to the player who made the action. The difference between xT and xGAdded is that xT cares about passes and dribbles that advance the ball towards the goal rather than only passes.
xT rewards each player action based on how much it contributed to the build-up play. The value of an action is equal to the percentage change in the team's chances of scoring in the next 5 actions due to the initial action.
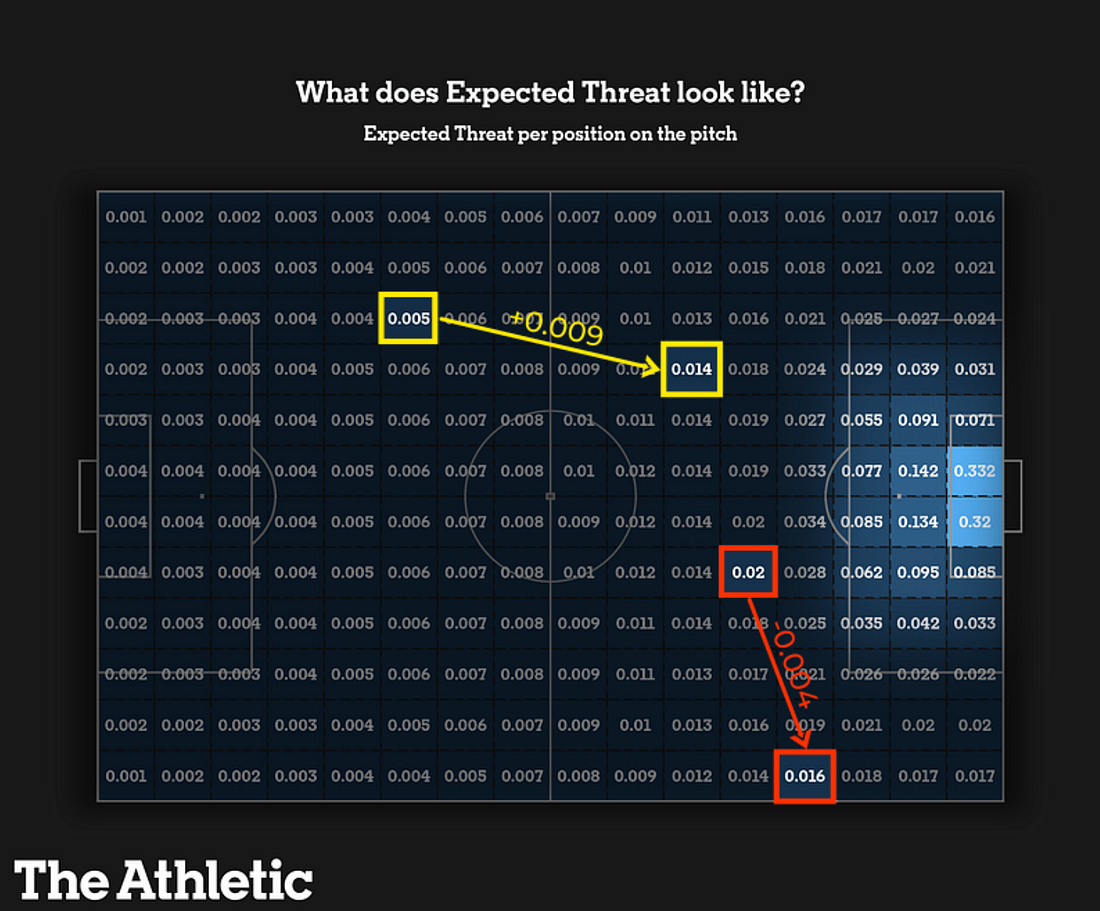
Above is one example model of the xT map (provided by The Athletic). As you can see, there are fixed numbers defining each part of the pitch, where the numbers get higher the closer to the goal you get.
If you observe the yellow pattern, you can see a positive increase of 0.009 (i.e. +0.9%) in xT when the ball is moved from the part of the pitch with 0.005 xT to 0.014. While the red pattern shows a decrease of 0.004 (-0.4%) in xT as the ball moves away from the goal.
xT is best observed through a defined period of time like a season, where you can observe the players who have high scores in this metric and by definition have more impact in moving the ball into more dangerous positions. Also, these negative scores when the ball moves away from the goal make sure that this metric is not biased towards players who move the ball around a lot with no meaning, as they are not allowed to stack up xT forever without losing some in the process.
The problem with xT lies within the fixed grid, which ignores any context and just maps out scores on the pitch.
VAEP (Valuing Actions by Estimating Probabilities) is similar to xT in that it assigns values to actions. xT and VAEP are similar approaches in the sense that they both value individual on-the-ball actions of players by computing the differences between the game-state values before and after the action. However, they approach the problem in different ways that lead to three important practical differences:
- Types of actions valued. xT is a "ball-progression model" and only values actions that move the ball from one zone to another (passes, dribbles, crosses). It ignores defensive actions like tackles and interceptions, as well as valuable offensive actions such as take-ons within the same zone. VAEP considers defensive actions like tackles, interceptions, and recoveries that do not progress the ball.
- Risk of actions. The xT model only values an action's offensive contribution. VAEP both values an action by considering the probability of conceding a goal and reasons about what happens after turnovers, better capturing risks.
- Interpretability. xT assigns values based on the location of the ball, which is easy to explain. VAEP uses a large set of features and a learned model, which is harder to explain.
Beyond Event Data
All along up until this point we were dealing with what is called Event Data, meaning the data only cares about the "event" or the "action". The only data we have is the action that happened, whether it's a pass, shot, tackle, interception, etc. We have the location of the action, the time, and the player who did the action, among other things.
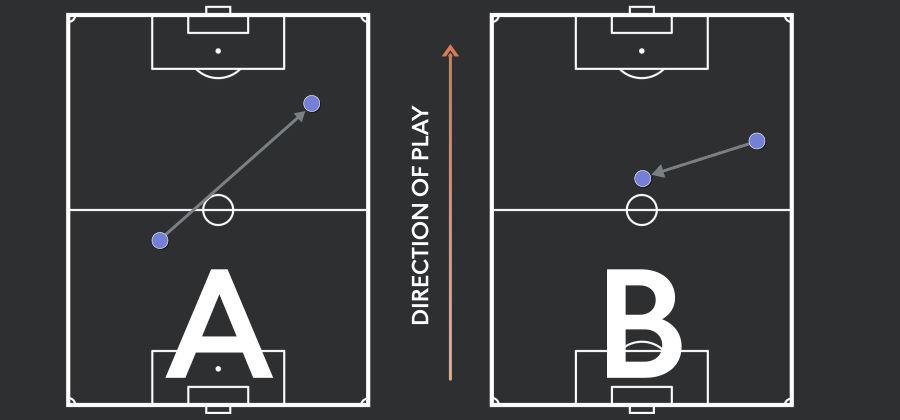
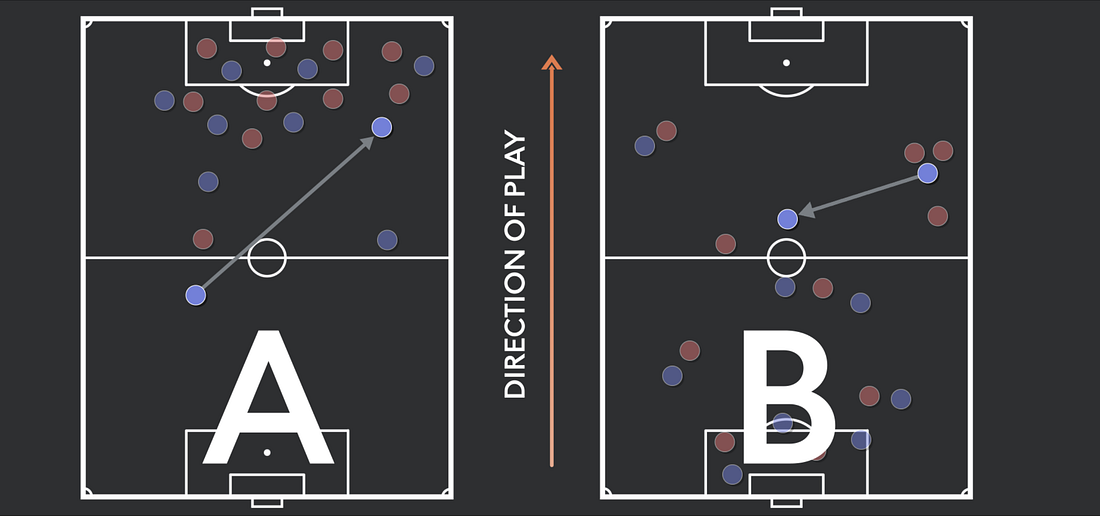
But clearly, something big is missing. To further clarify, let's take a look at these two situations:
Eyeballing it, most people would say pass A. Most of the metrics mentioned would support this conclusion: xT would give B a negative number since it's a backward pass; pass B wouldn't be considered progressive; xA or xGAdded wouldn't support pass B as it's backwards. But there's something clearly missing… Context. Where are the rest of the teammates? And more importantly, where is the opposing team?
Throughout this article we have only encountered stats that cared about the event without relying on any other information that could drastically change the assessment. So let's add some context.
Adding the positions of teammates and opponents into the equation, pass B now looks like a clutch pass in a counter-attack situation, while pass A is advancing the ball forwards in what seems to be an all-out-attack vs a park-the-bus situation.
Contextual Data
StatsBomb have what they call 360 Data: contextual event data collected by taking a screenshot (freeze frame) showing all players on camera for every event collected (approximately 3,300 events per match). Contextual Data covers a host of new information about the game that was either difficult to see or completely hidden in basic event data:
- Ball receipts in space.
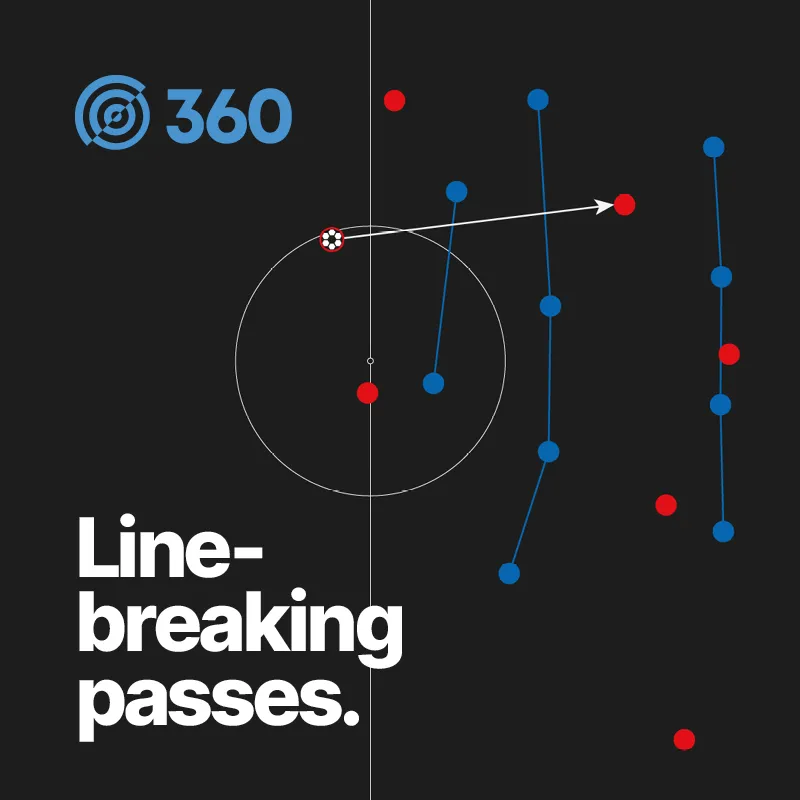
- Line-breaking passes.
- Distance to all defenders in the frame.
- Passing lanes.
- Defensive Island Events (DIEs).
- Defensive shape around every event.
We won't discuss them all, but we'll pick a few that fit our narrative.
Line-breaking Passes are open-play passes (excluding set pieces) that break a line of defence. For a pass to be considered line-breaking (according to StatsBomb), the rules are: the end location of the pass should be at least 10% closer to goal than the starting location, and the pass should intersect a pair of defenders who are within close proximity (x-axis) or pass behind the line of the defenders (y-axis).
So basically, a forward pass that bypasses at least 2 opponent players in a line is considered a line-breaking pass.
Speaking of bypassed opponents, there is an actual metric with the same name (Bypassed Opponents) which counts how many opponents a player's pass/dribble bypassed. An opponent is bypassed if, after a pass or a dribble, they are further away from their goal than the ball, and is therefore no longer able to defend the goal. Bypassed Opponents measures the effectiveness of a team's build-up play and credits players who manage to sneak a pass between the lines and help their team break the opponent's pressure.
Watch this clip of Toni Kroos bypassing at least 3 of Barcelona's players to send Vinícius into the penalty box, who in turn scores a goal.
The main issue with the Bypassed Opponents stat is that it doesn't take into account the phase of the game. Bypassing in a counter-attack is much easier than in a build-up.
Another similar metric is Bypassed Defenders. It's the same as Bypassed Opponents except it only counts defenders, which are the last 5 outfield players in each given scenario, closest to their own goal.
Watch this clip of Kevin De Bruyne bypassing 1 defender with his dribble, then 3 defenders with his pass to Jesus, who easily scores a tap-in into an open goal.
Bypassed Defenders differs from Bypassed Opponents in that it credits playmaking efforts at the last portion of the pitch, in reference to where the opponent's defenders are stationed. So mostly attackers and offensive midfielders will benefit more from it, while defenders and defensive midfielders will benefit more from Bypassed Opponents.
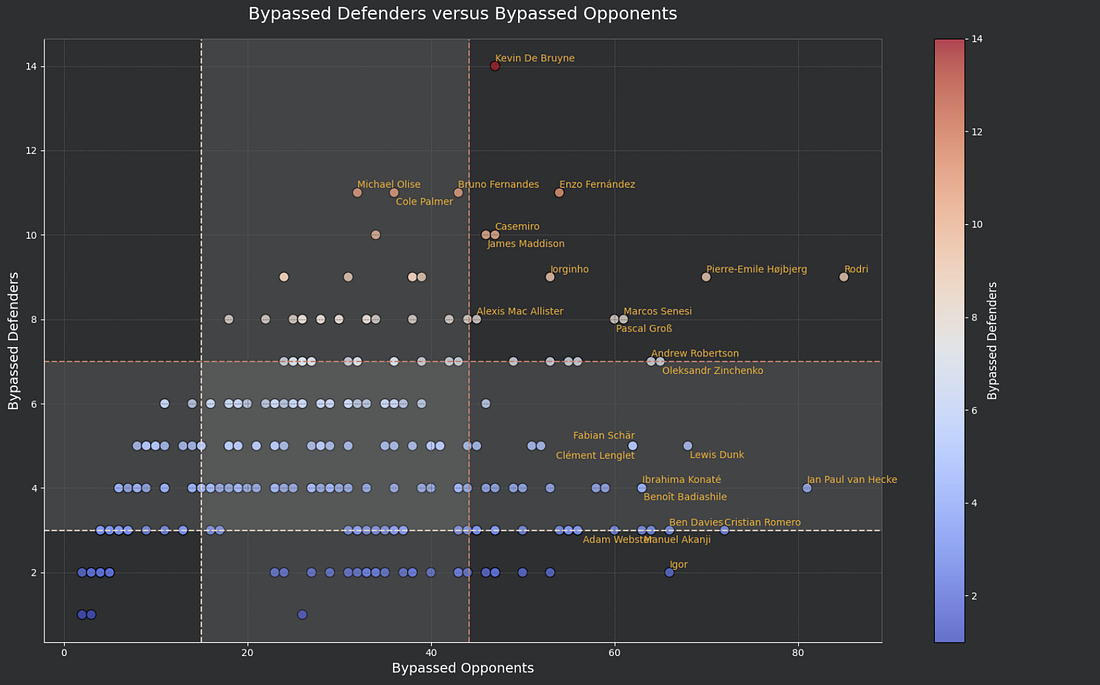
As shown in the graph for EPL 2023–24, players like Kevin De Bruyne, Bruno Fernandes, and Enzo Fernandez bypass a lot of defenders since their role is to break the defences higher up the pitch. Players like Cristian Romero, Ian-Paul van Hecke, and Igor bypass fewer defenders but a lot more opponents, since their roles are to break the advanced pressure lines closer to their own goal line. There are also players like Rodri and Pierre-Emile Højbjerg who excel at both metrics, making them pivotal players in both situations.
Summary
That was a lot to digest. Let's break it down:
- Even though back in the day, assists was maybe the only viable metric to judge a playmaker, as of now it's a show-off metric that traps you into a losing conversation.
- No one metric is good enough to judge any aspect of this game. There are too many roles and interactions to summarise it in just one number.
- Try and understand which metrics fit which positions, roles, and scenarios on the pitch. One metric might benefit a fast winger in a transitional team, while another might give more credit to a deep-lying midfielder in a slower, more controlling team.
- Not all metrics are available for free, so use whatever you have access to and don't forget to add context.
- Always add comparisons between metrics, as well as the minutes played for each player, to give a wider perspective.
If you're still confused about which metric to use and when, here's a small guide:
- xA is a good metric to measure the quality of chances created by a playmaker.
- Progressive Stats focus on a playmaker's role in advancing the ball forwards.
- xGC and xGB are sequence stats that credit players who participate in an offensive that might lead to a shot.
- xGAdded, xT, and VAEP give a wider perspective of a playmaker's role in advancing the ball forwards into relatively more dangerous positions.
- Line-breaking Passes, Bypassed Opponents, and Bypassed Defenders are contextual stats that add more information like opponents' and teammates' positions on the pitch.
A deep-lying midfielder might not score the best on metrics like xA or xT, but will do better in stats like Progressive Passes and Bypassed Opponents. A winger might score more in stats like xT, Bypassed Defenders, xA, and Progressive Carries if he dribbles well. Of course, this is an over-generalisation. Roles are now more complex and interchanging than ever.
And lastly, everything you provide must pass the eye test. No matter how advanced data analytics can get, it doesn't tell you the full story. You need to watch matches to form an opinion that you can fact-check with data.
If you made it to the end, thanks for taking the time to read.
Browse our collection of football analysis insights.